Is my site in google's mobile-first index?
Your site's web server logs will answer the question
As we know few sites have already moved to google’s mobile-first index.
Is your site in those few?
How can we know when our site has moved to google's mobile first index?
On 15/12/2017's Hangout, John Mueller gave an advice to SEOs:
“If you watch out for your log files probably you can notice [your site’s transition to the mobile-first index] fairly obviously.”
He explains that on an average site about 80% of the crawl is from googlebot-desktop and approximately 20% is expected from googlebot-smartphone.
Once your site has made the move to the mobile-first index, you will see that majority reverse. Googlebot-smartphone will be crawling your site more than googlebot-desktop.
For that reason, I decided to compare the useragents', googlebot-desktop, googlebot-smartphone crawls on my site.
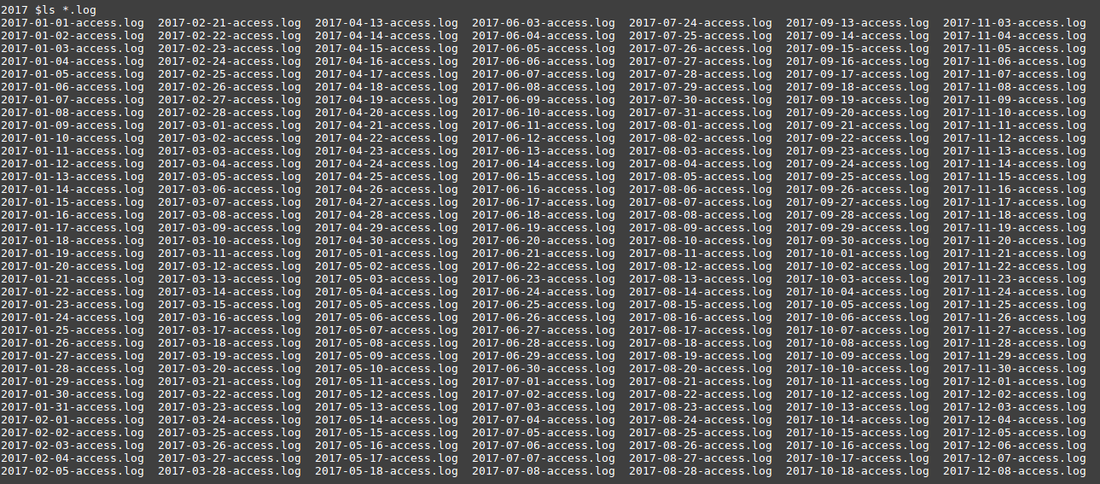
These are the web server logs of my website https://www.searchdatalogy.com/ dates between 01/01/2017 and 18/12/2017. There are 352 days of webserver logs files, almost 12 months. (We can not see some of them, too many to fit on the screen)

Nginx is the web server which my website is on, below is the format of the logs:
66.249.76.115 - - [18/Dec/2017:02:58:22 -0500] "GET / HTTP/1.1" 200 6105 "-" "Mozilla/5.0 (Linux; Android 6.0.1; Nexus 5X Build/MMB29P) AppleWebKit/537.36 (KHTML, like Gecko) Chrome/41.0.2272.96 Mobile Safari/537.36 (compatible; Googlebot/2.1; +http://www.google.com/bot.html)" "164734" "2"
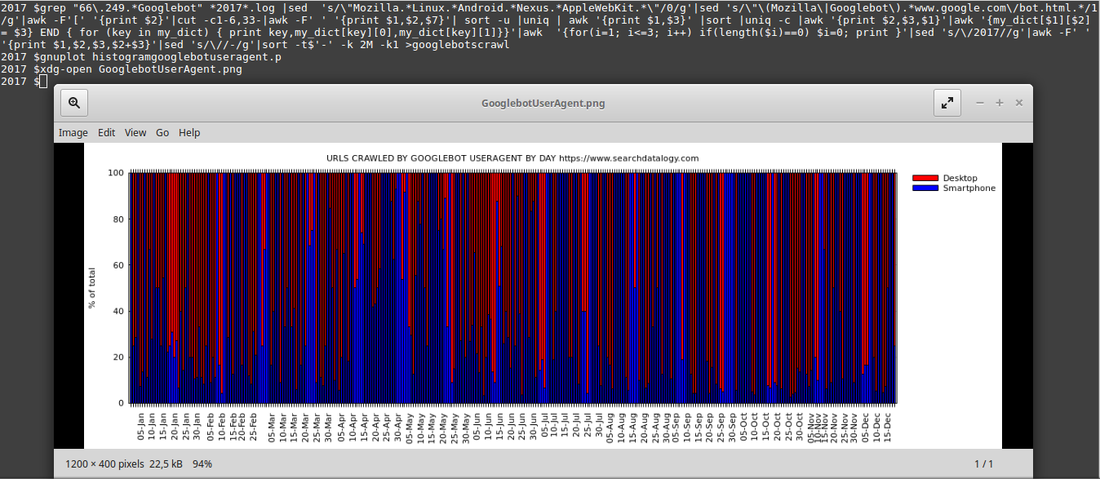
The commands which are used to extract data from web server log files and the graph obtained by using that input at the end are as follows:

1) The commands used to extract input data from web server logs for the graph:
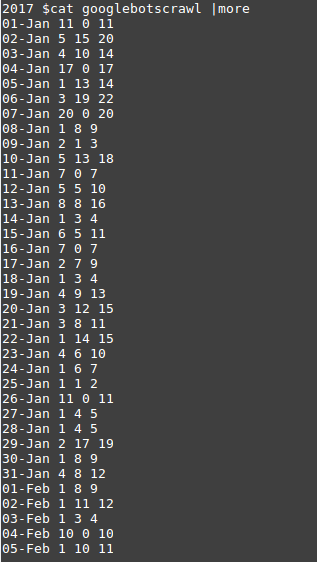
The columns following date information show the number of googlebot crawls by googlebot's user-agents, the second column is google-smartphone, the third column is google-desktop and on the fourth column, we find the total number of urls crawled by these user-agents. Empty crawls are replaced by 0 in the output file. This is needed for the graph which will be created with gnuplot later on.

2) The code used in file histogramgooglebotuseragent.p which is called by gnuplot:
clear
reset
unset key
set terminal pngcairo font "verdana,8" size 1200,400
# graph title
set title "URLS CRAWLED BY GOOGLEBOT USERAGENT BY DAY https://www.searchdatalogy.com"
set grid y
#y-axis label
set yrange [0:100]
set ylabel "% of total"
set key invert reverse Left outside
set output "GooglebotUserAgent.png"
set xtics rotate out
set ytics nomirror
# Select histogram data
set style data histogram
# Give the bars a plain fill pattern, and draw a solid line around them.
set boxwidth 0.75
set style fill solid 1.00 border -1
set style histogram rowstacked
xticreduce(col) = (int(column(col))%5 ==0)?stringcolumn(1):""
colorfunc(x) = x == 2 ? "blue" : x == 3 ? "red" : "blue"
titlecol(x) = x == 2 ? "Smartphone" : x == 3 ? "Desktop" : "2"
plot for [i=2:3] 'googlebotscrawl' using (100.*column(i)/column(4)):xtic(xticreduce(1)) title titlecol(i) lt rgb colorfunc(i)
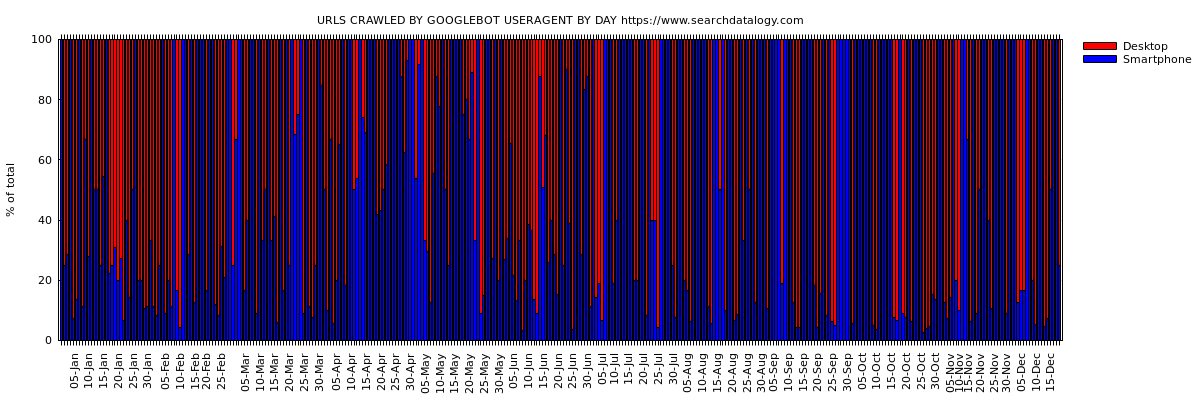
3) The graph showing 352 days of URLs crawled by Googlebot useragent by day:

Thanks for taking time to read this post. I offer consulting, architecture and hands-on development services in web/digital to clients in Europe & North America. If you'd like to discuss how my offerings can help your business please contact me via LinkedIn
Have comments, questions or feedback about this article? Please do share them with us here.
If you like this article


Comments