SEO Data Distribution Analysis
Before analyzing the distribution of SEO data, it is best to talk briefly about what SEO data is.
There are many sources of SEO data, but two are essential. One of them is data collected from websites crawls, the other one is data collected through web server logs of websites.
In this blog post, I would like to focus on analyzing the distribution of SEO data collected from the web server logs.
Again through the web server logs, it is mainly possible to obtain two types of data. One concerns the data on search engine bot crawls of the websites, which are crawled pages data, the other one is the search engine user visits to this website, which are active pages data.
This blog post presents the SEO data distribution analysis of crawled and active pages data. This data distribution analysis is also available as jupyter notebook on github SEO Data Distribution Analysis.
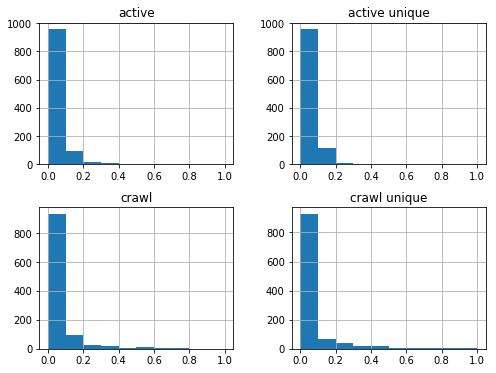
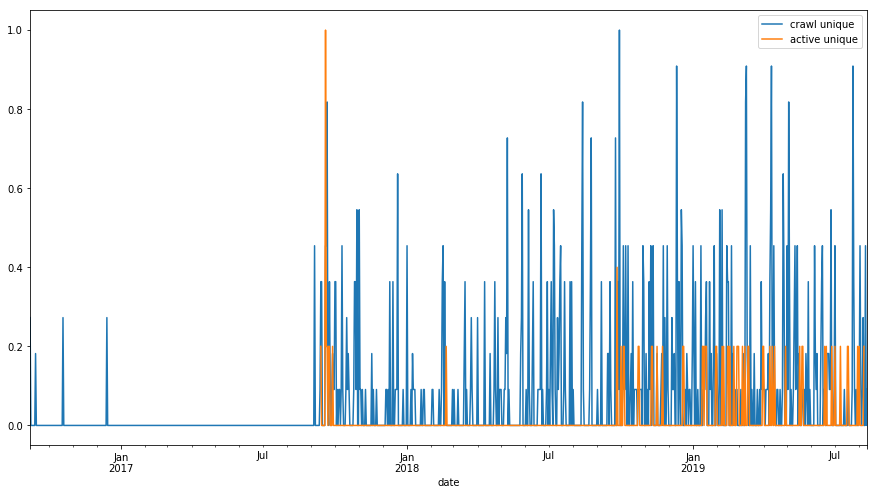
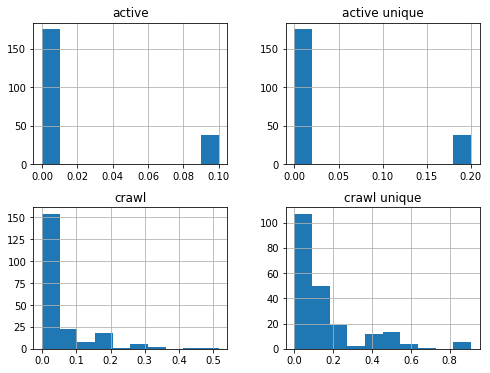
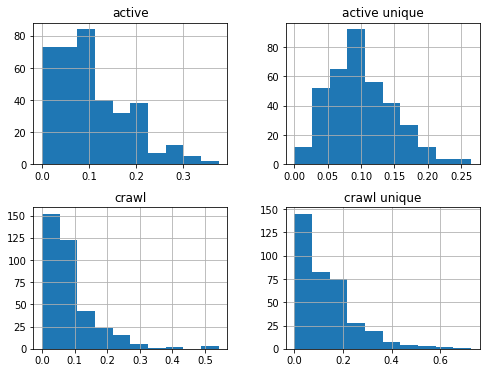
The data distribution analysis can be helpful in our SEO work. In these type of data analysis we can see that the SEO data distribution per year or per category of the pages are different. Observing the differences in SEO data distribution in different time frames or page categories can be helpful in segmentation of the SEO data. The data distribution analysis can also be useful in estimating roughly missing SEO data. For example, if we know certain category of pages have right-skewed daily crawl data distribution, in estimating missing daily crawl data of these type of pages we can take the median not the mean of these category of pages data. Or else if the data distribution is normal distribution then taking the mean of the data will be more accurate for estimating missing daily crawl data.
import pandas as pd
import numpy as np
import datetime as dt
import matplotlib.pyplot as plt
%matplotlib inline
from sklearn.preprocessing import MinMaxScaler
scaler = MinMaxScaler()
df_crawl = pd.read_csv("crawl.csv",parse_dates=['date'], index_col='date')
df_active = pd.read_csv('active.csv',parse_dates=['date'], index_col='date')
df_sum_crawl = df_crawl.resample('D').sum()
df_sum_active = df_active.resample('D').sum()
df_sum = pd.concat([df_sum_crawl, df_sum_active], axis=1)
df_sum[['crawl','crawl unique','active','active unique']] = scaler.fit_transform(df_sum[['crawl','crawl unique','active','active unique']])
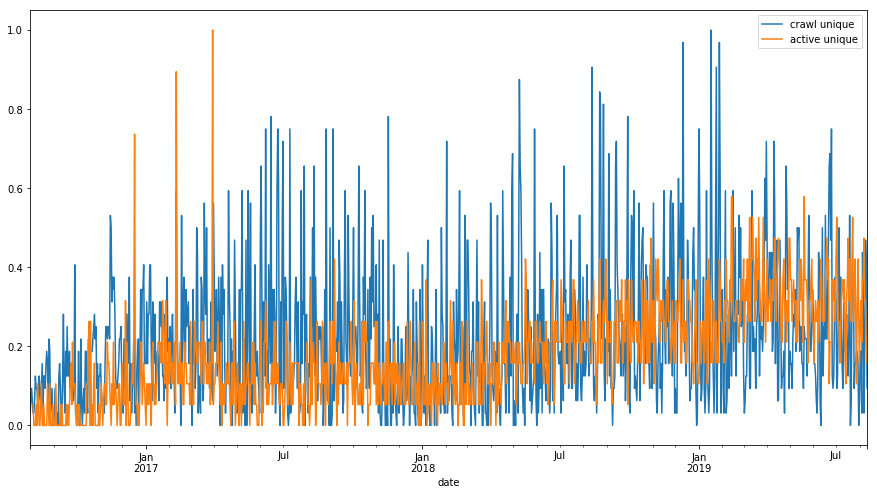
df_sum[['crawl unique','active unique']].plot(figsize=(15,8));
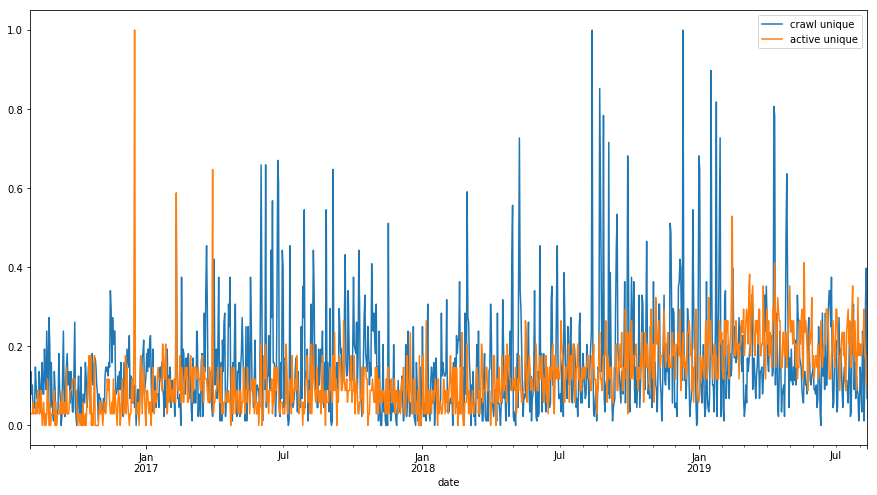
df_sum.hist(figsize=(8,6));
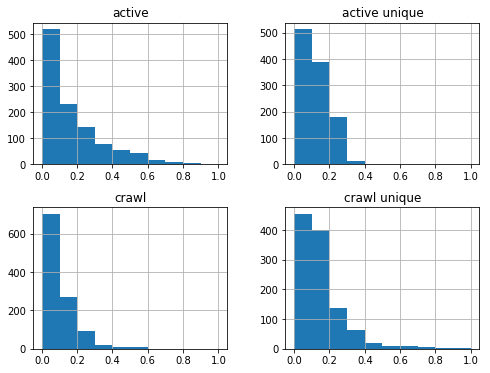
df_sum['2016-08-01':'2017-08-01'].hist(figsize=(8,6));
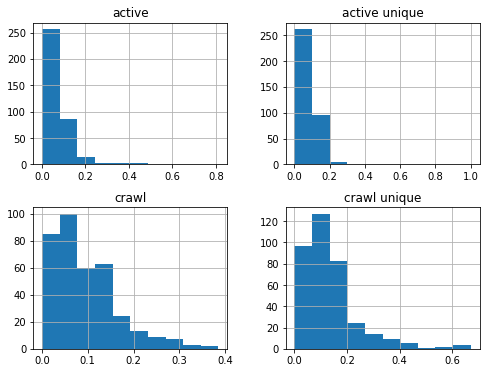
df_sum['2017-08-01':'2018-08-01'].hist(figsize=(8,6));
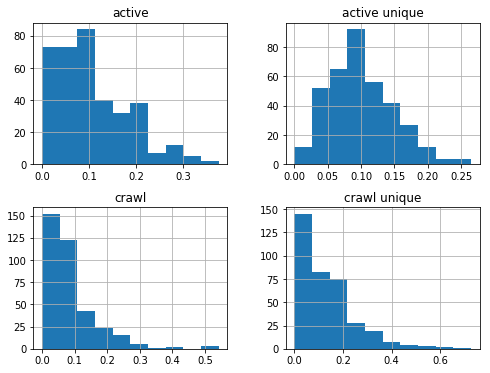
df_sum['2018-08-01':'2019-08-01'].hist(figsize=(8,6));
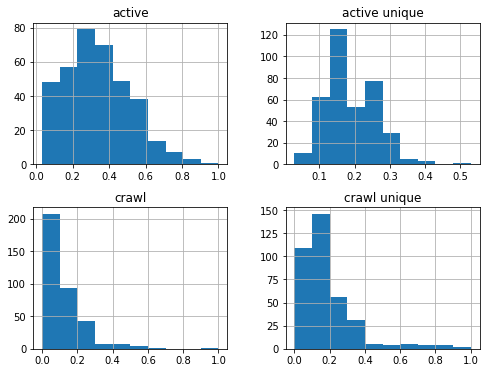
scaler = MinMaxScaler()include = ['/blog/']exclude = ['/tag/','/archive/','page','.html','/category/','/en/','/admin/','author','//']df_select_crawl = df_crawl[df_crawl.request_url.str.contains('|'.join(include))]df_select_active = df_active[df_active.request_url.str.contains('|'.join(include))]df_select_crawl = df_select_crawl[(~df_select_crawl.request_url.str.endswith('/blog/'))]df_select_active = df_select_active[(~df_select_active.request_url.str.endswith('/blog/'))]df_select_crawl = df_select_crawl[(~df_select_crawl.request_url.str.contains('|'.join(exclude)))].resample('D').sum()df_select_active = df_select_active[(~df_select_active.request_url.str.contains('|'.join(exclude)))].resample('D').sum()df_sum = pd.concat([df_select_crawl, df_select_active], axis=1)df_sum[['crawl','crawl unique','active','active unique']] = scaler.fit_transform(df_sum[['crawl','crawl unique','active','active unique']])df_sum[['crawl unique','active unique']].plot(figsize=(15,8));
df_sum['2019-01-01':'2019-08-01'].hist(figsize=(8,6));
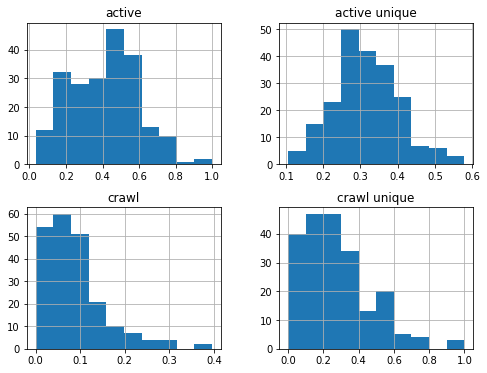
df_sum['2019-01-01':'2019-08-01'].median()
dtype: float64
df_sum['2019-01-01':'2019-08-01'].mean()
dtype: float64
scaler = MinMaxScaler()
include = ['/tag/','/archive/','page','/category/']
df_select_crawl = df_crawl[df_crawl.request_url.str.contains('|'.join(include))].resample('D').sum()
df_select_active = df_active[df_active.request_url.str.contains('|'.join(include))].resample('D').sum()
df_sum = pd.concat([df_select_crawl, df_select_active], axis=1)
df_sum[['crawl','crawl unique','active','active unique']] = scaler.fit_transform(df_sum[['crawl','crawl unique','active','active unique']])
df_sum[['crawl unique','active unique']].plot(figsize=(15,8));
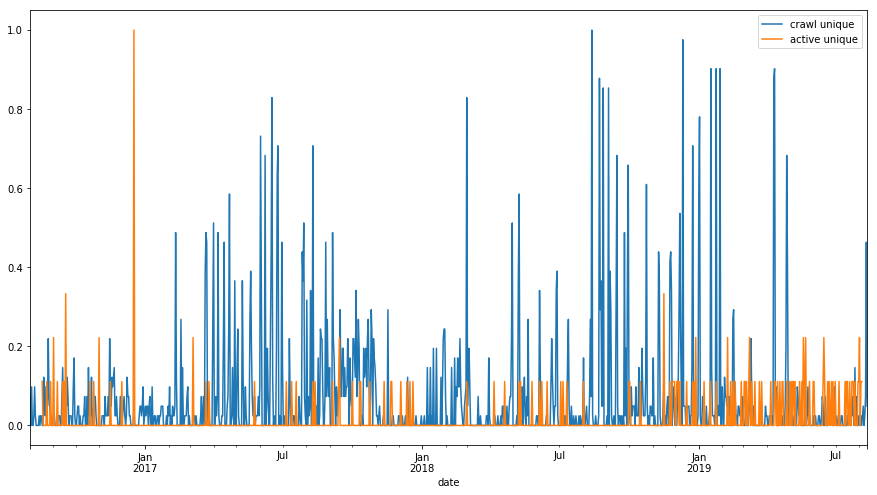
df_sum.hist(figsize=(8,6));
df_sum['2019-01-01':'2019-08-01'].median()
dtype: float64
scaler = MinMaxScaler()
include = ['.html']
df_select_crawl = df_crawl[df_crawl.request_url.str.contains('|'.join(include))].resample('D').sum()
df_select_active = df_active[df_active.request_url.str.contains('|'.join(include))].resample('D').sum()
df_sum = pd.concat([df_select_crawl, df_select_active], axis=1)
df_sum[['crawl','crawl unique','active','active unique']] = scaler.fit_transform(df_sum[['crawl','crawl unique','active','active unique']])
df_sum[['crawl unique','active unique']].plot(figsize=(15,8));
df_sum['2019-01-01':'2019-08-01'].hist(figsize=(8,6));
Thanks for taking time to read this post. I offer consulting, architecture and hands-on development services in web/digital to clients in Europe & North America. If you'd like to discuss how my offerings can help your business please contact me via LinkedIn
Have comments, questions or feedback about this article? Please do share them with us here.
If you like this article


Comments