Technical SEO Log Analysis On Linux
Web Server Logs Analysis is the essential part of Technical Search Engine Optimization. Without analyzing the valuable data in log files any Technical SEO Audit will be incomplete. It is the only place where you can get accurate information about how search engine bots are crawling your website and on which pages of your site they are sending search engine users.
On this website, I would like to explore and show possible ways of analyzing web server logs files. I choose to begin with analyzing web server log files for SEO on Linux. First of all, it is impossible to analyze huge websites web server log files only with Linux commands. However if you have a small website like mine, you can get the job done perfectly with this methodology by yourself without having any need to third party web server logs analysis tools SaaS or not.
These are the web server logs of my website https://www.searchdatalogy.com/ dates between 01/08/2016 and 20/11/2016. There are 112 days of webserver logs files, almost 4 months.

Nginx is the web server which my website is on, below is the format of the logs:
66.249.75.127 - - [01/Aug/2016:17:43:15 -0400] "GET /contact/ HTTP/1.1" 200 2630 "-" "Mozilla/5.0 (compatible; Googlebot/2.1; +http://www.google.com/bot.html)"
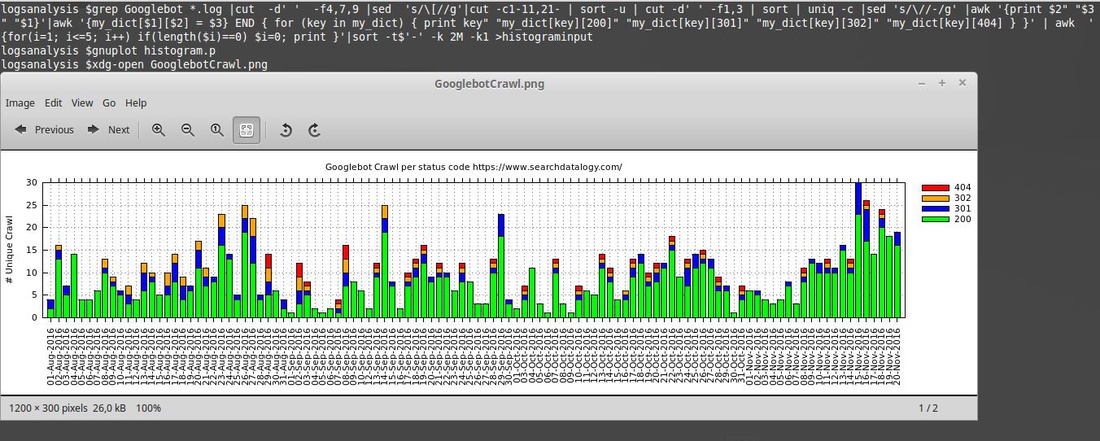
The commands which are used to extract data from web server log files and the graph obtained by using that input at the end are as follows:

1) The commands used to extract input data from web server logs for the graph:
grep Googlebot *.log |cut -d' ' -f4,7,9 |sed 's/\[//g'|cut -c1-11,21- | sort -u | cut -d' ' -f1,3 | sort | uniq -c |sed 's/\//-/g' |awk '{print $2" "$3" "$1}'|awk '{my_dict[$1][$2] = $3} END { for (key in my_dict) { print key" "my_dict[key][200]" "my_dict[key][301]" "my_dict[key][302]" "my_dict[key][404] } }' | awk '{for(i=1; i<=5; i++) if(length($i)==0) $i=0; print }'|sort -t$'-' -k 2M -k1
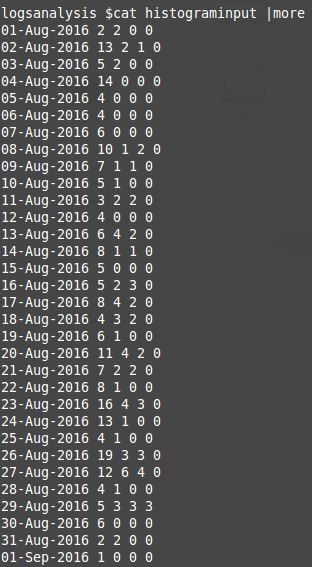
The columns following Date information show the number of googlebot crawls by selected status codes 200, 301, 302, 404 which are listed in that order. Empty crawl of status codes are replaced by 0 in the output file. This is needed for the graph which will be created with gnuplot later on.

2) The code used in file histogram.p which is called by gnuplot:
clear
reset
unset key
set terminal pngcairo font "verdana,8" size 1200,300
# graph title
set title "Googlebot Crawl per status code https://www.searchdatalogy.com/"
set grid y
#y-axis label
set ylabel "# Unique Crawl"
set key invert reverse Left outside
set output "GooglebotCrawl.png"
set xtics rotate out
set ytics nomirror
# Select histogram data
set style data histogram
# Give the bars a plain fill pattern, and draw a solid line around them.
set boxwidth 0.75
set style fill solid 1.00 border -1
set style histogram rowstacked
colorfunc(x) = x == 2 ? "green" : x == 3 ? "blue" : x == 4 ? "orange" : x == 5 ? "red": "green"
titlecol(x) = x == 2 ? "200" : x == 3 ? "301" : x == 4 ? "302" : x == 5 ? "404": "200"
plot for [i=2:5] 'histograminput' using i:xticlabels(1) title titlecol(i) lt rgb colorfunc(i)
3) The graph showing 112 days of daily Googlebot crawl data per status code:

Thanks for taking time to read this post. I offer consulting, architecture and hands-on development services in web/digital to clients in Europe & North America. If you'd like to discuss how my offerings can help your business please contact me via LinkedIn
Have comments, questions or feedback about this article? Please do share them with us here.
If you like this article


Comments